EDA Costs and Performance Benchmark benefits:
- Unique Benchmark of your EDA software costs / designer versus the average of your choice of peer group of 4 or more companies
- Improve market understanding of often the most expensive IC design overhead
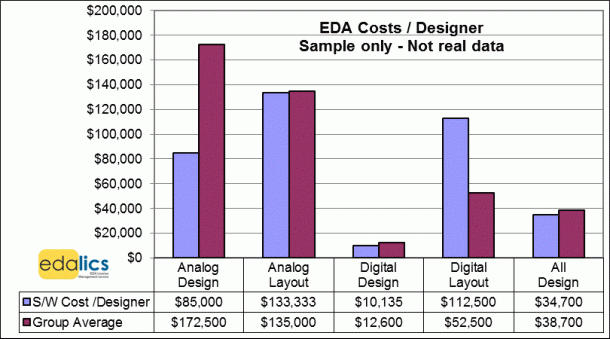
- Includes EDA costs for 4 design sub-categories: Analog Design, Analog Layout, Digital Design & P&R Layout (see sample bar chart below)

- An interpretation discussion of the report findings is included to provide an external perspective to inform any appropriate actions
- Scope now broadened to encompass EDA performance KPIs which improve productivity in the IC design process:
EDA tools costs / designer (overall and for digital / analog, frontend / backend)
% of IC designers working at various process nodes
Avg. IP budget as % of EDA budget spend
Avg. compute server budget as % of EDA budget
% of compute server budget for cloud compute (vs. on-prem)
% cloud compute spend by provider: Microsoft Azure, Amazon Web Services, Google Cloud
% cloud compute spend by Instance type: a) on-demand / pay-as-you-go b) reserved C) spot
% of each job type run in the cloud (e.g. P&R, DRC & LVS, Verification, etc, etc)
% Analog Design resources vs. % Digital Design resources
Ratios of backend to frontend design resources: for both digital & analog
# simulation licenses/ designer: for both digital & analog
Emulation & FPGA Prototyping budgets as % of EDA budget
% IP budget spend by IP sub-categories
NXP Semiconductors : “….This was consultancy as it should be: hands-on advice …. and professional benchmarking.”
edalics’ main emphasis in the benchmarking process is on the two most critical potential pitfalls, the compatibility of the participating companies and the accuracy of the submitted input data.
To request further information simply email: Benchmark@edalics.com

